🧵Data Physicalization Resources
Claudia Berger maintains a Zotero “physical data viz” group library containing nearly 100 articles, datasets, and other relevant reads.
I added several items to that library this past week, and wanted to capture my Bluesky thread about them for the blog:
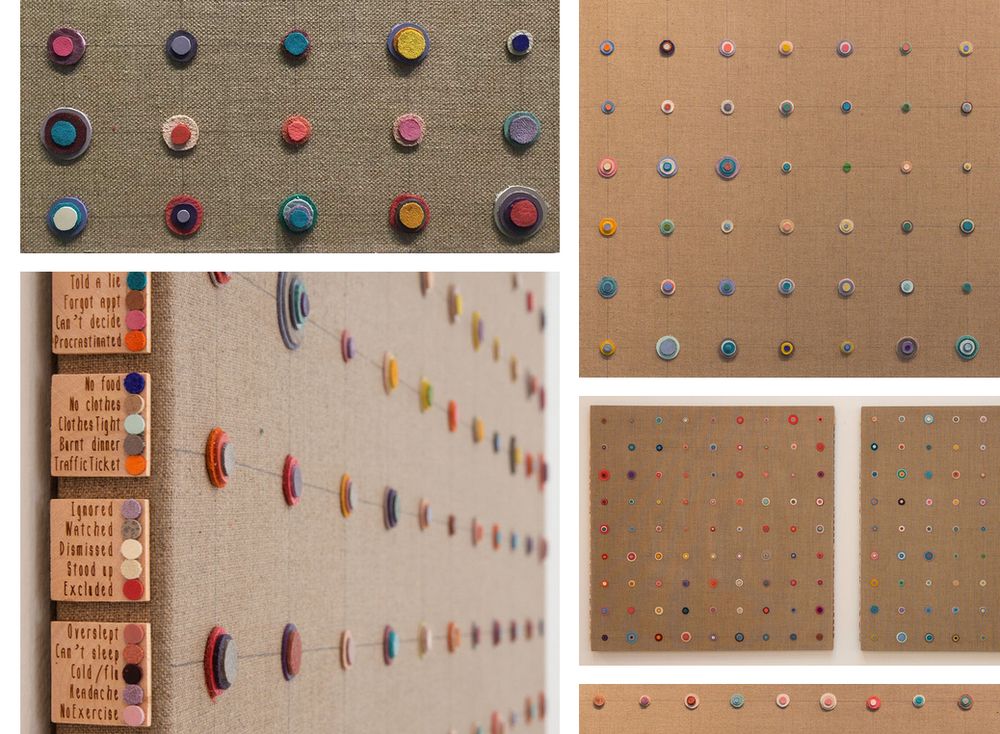
Personal stress data as commentary on stress-impacted health issues
Laurie Frick’s “Stress Inventory” uses leather discs on stretched linen, piled and colored to record daily irritation levels & highlight stress’ contribution to chronic health issues. (HT Laura Miller)
Weaving data analysis of speculative fiction
Quinn Daedel’s “The Locked Loom 1: Gideon the Ninth” discusses a weaving text visualization and analysis based on elements of everyone’s favorite “lesbian necromancers in space” fantasy novel (the Locked Tomb Series; highly recommend, it is not silly/pulp despite that being a fitting descriptor, but rather epic, page-turning speculative fiction/sci fi).
Baking data-displaying cakes for climate change advocacy
An interview with “baker-turned-glacier guide” Rose Mcadoo on her “Cakes for Climate Change” combating climate demise through educational cakes and desserts that explain the natural processes behind glaciology and climate change.
Workflow for turning ambient audio data into 3D prints
Audrey Desjardins’ and Timea Tihanyi’s “ListeningCups: A Case of Data Tactility & Data Stories” documents a workflow for capturing data, creating 3D printed porcelain cups embedded with datasets of everyday ambient sounds; and shares reflections around experiences such as “data accidents” (HT Beth Mitchell)
Reflections from installing a data physicalization exhibit
Claudia Berger and Chris Alen Sula’s piece on lessons learned from installing a data physicalization of a HASTAC conference’s metadata, published in Nightingale (the journal of the Data Visualization Society).
Building data intended for (sometimes physical) art
“Datasets as Imagination” by Lisa Shroff argues for collectively built datasets shaped specifically for reuse by artists for art, including for physical data exhibits. (HT Zoe LeBlanc)
Library research guide for data physicalization
“Data Driven Creativity: Making Data Physicalizations” is a library guide by Ariel Ackerly, Sarah Reiff Conell, and Ofira Schwartz, gathering datasets, projects, and writing about data physicalizations.
(“HT” is shorthand for “hat tip”, a minimal-characters way people say “I found this link via this other person sharing it in the past; thanks to them”.)